This Juptyer Notebooks will allow for the graphing of erosion data. We will use the Discovery Science - Erosion: Here Today, gone Tomorrow Module to test soil erosion (Flash Player must be Enabled on the computer to run the Module).
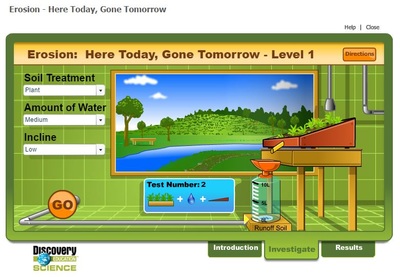
1. What is erosion? How is it different from weathering? 2. How does deposition relate to erosion and weathering?The erosion module allows you to adjust and see how different variables impact soil erosion. Variables you can adjust include soil treatment, amount of water, and incline. To start testing, make sure that you click on Investigate, type in your name, and select Level 1.
This graph will display the results for soil erosion with no soil treatment and low incline, testing the effects of 'low', 'medium' and 'high' water. To run the block of code and all of the code blocks below, you will hit Shift + Enter.
In [1]:#importing what we'll need to use our data. import numpy as np import pandas as pd %matplotlib inline import matplotlib.pyplot as plt; plt.rcdefaults() import matplotlib.pyplot as pltIn [2]:objects1 = ('Low Water', 'Medium Water', 'High Water') y_pos = np.arange(len(objects1)) notreatment1 = [4,6,7] plt.bar(y_pos, notreatment1, align='center', alpha=0.5, color ="b") plt.xticks(y_pos, objects1) plt.ylim(0,11) plt.ylabel('Soil Runoff in Litres') plt.title('Soil Erosion with No Soil Treatment and Low Incline') plt.show()Part 1 Questions - Low Incline with No Treatment
3. What impact did increasing the water have on the soil erosion? 4. What was the erosion difference between the low water and high water? 5. How do you think adding plants will impact the amount of soil erosion?Making a Bar Graph of the Data for Soil Erosion with Plants and Low Incline
Using the "Eroison: Here Today, Gone Tomorrow" Module run tests for soil erosion for the PLANTS soil treatment with LOW INCLINE for 'low', 'medium' and 'high' water. Write down your results in a data table, then enter them in the code below where it says planterosion = [1,1,1].
In [3]:objects2 = ('Low Water', 'Medium Water', 'High Water') y_pos = np.arange(len(objects2)) #Insert your data below. Make sure that the data is entered in the correct order. #All the data is preset to 1 Litre. Order: # Low Water # Medium Water # High Water planterosion = [1,1,1] plt.bar(y_pos, planterosion, align='center', alpha=0.5, color ="g") plt.xticks(y_pos, objects2) plt.ylim(0,11) plt.ylabel('Soil Runoff in Litres') plt.title('Soil Erosion with Plants and Low Incline') plt.show()Part 1 Questions (cont) - Low Incline Erosion with Plants
6. Comparing this graph to the first one, what impact did the plants have on erosion? Can you quantify this impact? 7. What effect do plants have on the amount of erosion? What application might this serve in the real-world?Part 2: Comparing Two Variables
Making a Bar Graph of the Data for Soil Erosion with No Treatment (Changing Water and Incline)
This graph will display all results for soil erosion with no soil treatment including 'low', 'medium' and 'high' water and 'low', 'medium', and 'steep' incline.
In [4]:objects3 = ('Low Water - Low Incline', 'Low Water - Medium Incline', 'Low Water - Steep Incline', 'Medium Water - Low Incline', 'Medium Water - Medium Incline','Medium Water - Steep Incline','High Water - Low Incline', 'High Water - Medium Incline','High Water - Steep Incline') y_pos = np.arange(len(objects3)) notreatment2 = [4,5,6,6,7,8,7,8,10] plt.bar(y_pos, notreatment2, align='center', alpha=0.5, color ="cry") plt.xticks(y_pos, objects3, rotation=90) plt.ylim(0,11) plt.ylabel('Soil Runoff in Litres') plt.title('Soil Erosion with No Soil Treatment') plt.show()Part 2 Questions - Comparing Two Variables (Water and Incline) with No Soil Treatment
8. What impact do you think changing the incline will have on the amount of soil erosion? How might this change how landscapers and architects build on a slope? 9. What variable do you think has the biggest impact, water or incline? Explain. 10. Why did we change only one variable for each test run?Making a Bar Graph of the Data for Soil Erosion with Plants (Changing Water and Incline)
Using the "Eroison: Here Today, Gone Tomorrow" Module run tests for soil erosion for the PLANTS soil treatment with for 'low', 'medium' and 'high' water and 'low', 'medium', and 'steep' incline. Write down your results in a data table, then enter them in the code below where it says planterosion2 = [1,1,1,1,1,1,1,1,1].
In [5]:objects4 = ('Low Water - Low Incline', 'Low Water - Medium Incline', 'Low Water - Steep Incline', 'Medium Water - Low Incline', 'Medium Water - Medium Incline','Medium Water - Steep Incline','High Water - Low Incline', 'High Water - Medium Incline','High Water - Steep Incline') y_pos = np.arange(len(objects4)) #Insert your data below in the [ ]. Make sure that the data is entered in the correct order. #All the data is preset to 1 Litre. Order: # Low Water - Low Incline # Low Water - Medium Incline # Low Water - Steep Incline # Medium Water - Low Incline # Medium Water - Medium Incline # Medium Water - Steep Incline # High Water - Low Incline # High Water - Medium Incline # High Water - Steep Incline planterosion2 = [1,1,1,1,1,1,1,1,1] plt.bar(y_pos, planterosion2, align='center', alpha=0.5, color ="gmk") plt.xticks(y_pos, objects4, rotation=90) plt.ylim(0,11) plt.ylabel('Soil Runoff in Litres') plt.title('Soil Erosion with Plants') plt.show()Part 2 Questions (cont) - Comparing Two Variables with Plants
11. Which 3 test runs have the same amount of runoff? 12. Why do you believe that the amount of runoff is the same for those 3 test runs?Erosion Bonus Section - Changing the Type of Soil
Open up Eroison: Here Today, Gone Tomorrow again in a new tab. This time click on Level 2, which now allows you to also adjust the type of soil. Run run tests for soil erosion for the PLANTS soil treatment with medium incline for 'low', 'medium' and 'high' water and 'sand', 'silt', and 'Sand/Soil Mixture' Soil Types. Write down your results in a data table, then enter them in the code below where it says level2 = [1,1,1,1,1,1,1,1,1].
In [6]:objectsb = ('Medium Water - Low Incline - Sand', 'Medium Water - Low Incline - Silt', 'Medium Water - Low Incline - Sand/Silt Mix','Medium Water - Medium Incline - Sand', 'Medium Water - Medium Incline - Silt', 'Medium Water - Medium Incline - Sand/Silt Mix', 'Medium Water - Steep Incline - Sand', 'Medium Water - Steep Incline - Silt', 'Medium Water - Steep Incline - Sand/Silt Mix') y_pos = np.arange(len(objectsb)) #Insert your data below in the [ ]. Make sure that the data is entered in the correct order. #All the data is preset to 1 Litre. Order: # Medium Water - Low Incline - Sand # Medium Water - Low Incline - Silt # Medium Water - Low Incline - Sand/Silt Mix # Medium Water - Medium Incline - Sand # Medium Water - Medium Incline - Silt # Medium Water - Medium Incline - Sand/Silt Mix # Medium Water - Steep Incline - Sand # Medium Water - Steep Incline - Silt # Medium Water - Steep Incline - Sand/Silt Mix level2 = [1,1,1,1,1,1,1,1,1] plt.bar(y_pos, level2, align='center', alpha=0.5, color =["#C5B358", "#782F40", "k"]) plt.xticks(y_pos, objectsb, rotation=90) plt.ylim(0,11) plt.ylabel('Soil Runoff in Litres') plt.title('Soil Erosion with Plants & Medium Water (Level 2)') plt.show()Bonus Questions
13. What do you think would happen if we could also adjust the soil type to sand or silt? Which soil type more accurately matches most of Florida’s? 14. What was the dependent variable in all of the scenarios? How do you know? What were the two independent variables that were tested in this activity? 15. What are some of the benefits of modeling erosion in the simulation and analyzing it with coding? What were some of the limitations?
- ErosionFinal
- Erosion_Turner
- Morphological_Image_Processing-checkpoint
- erodibilityFct
- lab3
- igarss_chad_03
- 001_seiching
- Coastal_Change_Classifier
- Analysis-checkpoint
- north_carolina_piedmont_hillslope_class_notebook
